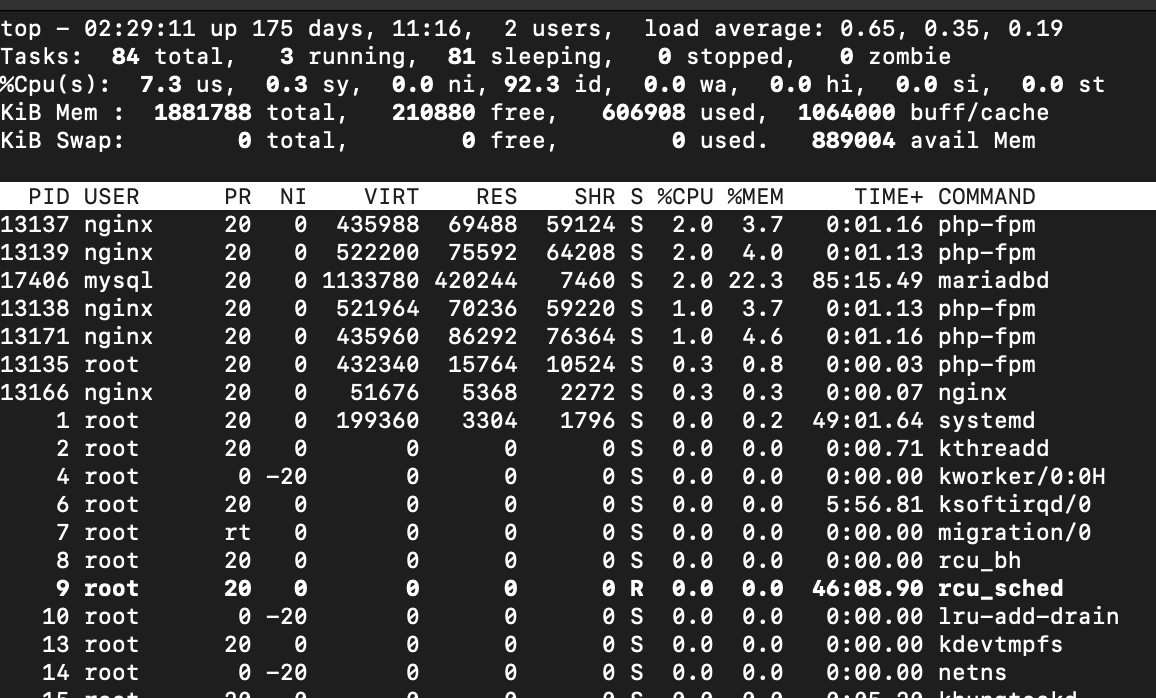
Have you ever wondered what’s really happening inside your Linux system? Picture this: you’re running multiple applications, your system feels sluggish, and you need answers fast. That’s where the top command becomes your best friend. It’s like having X-ray vision into your system’s soul, showing you exactly which processes are consuming your precious resources.
The Linux top command isn’t just another terminal utility—it’s your window into real-time system performance. Whether you’re a system administrator managing servers or a developer optimizing applications, understanding top command columns is essential for effective system monitoring and troubleshooting.
What is the Linux Top Command?
The top command is a dynamic, real-time system monitor that displays running processes and system resource utilization. Think of it as the Linux equivalent of Windows Task Manager, but with much more detailed information and powerful customization options.
When you type top in your terminal, you’re essentially asking your system: “Show me what’s happening right now.” The command responds with a wealth of information about CPU usage, memory consumption, running processes, and system load—all updated every few seconds.
What makes top particularly valuable is its ability to provide both a bird’s-eye view of system health and granular details about individual processes. This dual perspective helps you quickly identify performance bottlenecks and resource-hungry applications.
Understanding the Top Command Interface
Summary Area vs. Task Area
The top interface is cleverly divided into two main sections that work together to give you complete system visibility. The upper section, called the summary area, acts like your system’s dashboard. It displays critical information about uptime, load average, CPU usage, and memory statistics.
Below that, you’ll find the task area—a detailed list of all running processes. This is where you’ll spend most of your time analyzing individual applications and their resource consumption patterns.
Real-Time Updates and Refresh Intervals
By default, top refreshes its display every 3 seconds, but you can customize this interval to suit your monitoring needs. For high-frequency monitoring, you might want updates every second, while for general system observation, longer intervals like 5-10 seconds work perfectly.
The real-time nature of top means you’re seeing live data, not historical snapshots. This immediacy is crucial when diagnosing performance issues or monitoring system behavior during peak usage periods.
Breaking Down the Top Command Header Information
System Uptime and Load Average
The first line of top output shows your system’s current time, uptime (how long the system has been running), number of logged-in users, and load average. The load average is particularly important—it shows system load over the last 1, 5, and 15 minutes.
A load average of 1.0 means your system is fully utilized but not overloaded. Values above 1.0 indicate the system is working harder than its capacity, while values below 1.0 suggest available resources.
Tasks Overview
The Tasks line provides a quick snapshot of process states. You’ll see the total number of processes, along with how many are running, sleeping, stopped, or zombie processes. This information helps you understand overall system activity at a glance.
CPU Usage Statistics
User Space vs. System Space
The CPU line breaks down processor utilization into several categories. The “us” (user space) percentage shows time spent on user processes, while “sy” (system) represents kernel-level operations. Understanding this split helps identify whether performance issues stem from applications or system-level operations.
Idle Time and Wait States
The “id” (idle) percentage shows how much CPU capacity remains unused—higher idle percentages generally indicate good performance headroom. The “wa” (wait) percentage reveals time spent waiting for I/O operations, which can indicate storage bottlenecks.
Memory and Swap Information
The memory and swap lines show physical and virtual memory utilization. This information is crucial for identifying memory pressure and potential performance degradation due to excessive swapping.
Complete Guide to Top Command Columns
Process Identification Columns
PID (Process ID)
Every process in Linux gets a unique Process ID—think of it as a social security number for programs. The PID column displays this identifier, which you’ll use for process management tasks like killing unresponsive applications or changing process priorities.
PIDs are assigned sequentially, so lower numbers typically indicate processes that started earlier in the boot sequence. Process 1 is always the init system, while higher numbers represent more recently launched applications.

USER (Process Owner)
The USER column shows which user account owns each process. This information is vital for security auditing and resource allocation. You’ll often see “root” for system processes and various user names for applications launched by specific users.
Understanding process ownership helps identify potential security issues and makes it easier to track resource usage by different users or applications.
Priority and Scheduling Columns
PR (Priority)
Process priority determines how the Linux scheduler allocates CPU time. Lower priority values mean higher actual priority—it’s counterintuitive but important to remember. Real-time processes show “RT” in this column, indicating they have the highest scheduling priority.
NI (Nice Value)
The nice value influences process priority and ranges from -20 (highest priority) to 19 (lowest priority). Regular users can only increase nice values (lower priority), while root can decrease them. This system prevents users from monopolizing system resources.
Memory Usage Columns
VIRT (Virtual Memory)
Virtual memory represents the total memory space a process could potentially use. This includes mapped files, shared libraries, and swap space. High virtual memory usage isn’t necessarily problematic since it doesn’t directly correlate with physical memory consumption.
RES (Resident Memory)
Resident memory shows the actual physical RAM currently used by a process. This is the most important memory metric for performance analysis since it represents real memory consumption that can’t be swapped out immediately.
SHR (Shared Memory)
Shared memory represents memory that could potentially be shared with other processes. This includes shared libraries and memory-mapped files. Understanding shared memory helps optimize system memory usage, especially in multi-process applications.
Performance Metrics Columns
%CPU (CPU Percentage)
The CPU percentage shows how much processor time a process consumed since the last update. Values can exceed 100% on multi-core systems since each core contributes to the total. A process showing 200% CPU usage on a quad-core system is using half the available processing power.
%MEM (Memory Percentage)
Memory percentage represents a process’s share of total physical memory. This metric helps quickly identify memory-intensive applications and potential memory leaks. Applications consistently consuming high memory percentages warrant closer investigation.
TIME+ (CPU Time)
CPU time shows the total processor time consumed by a process since it started. This cumulative metric helps identify long-running processes and those with historically high CPU usage, even if their current usage appears low.
Process Status and Command Columns
S (Status)
The status column uses single letters to indicate process states. “R” means running, “S” indicates sleeping (waiting for events), “D” shows uninterruptible sleep (usually I/O operations), “T” represents stopped processes, and “Z” identifies zombie processes.
Understanding process states helps diagnose system behavior and identify problematic processes that might be stuck in undesirable states.
COMMAND (Process Command)
The COMMAND column displays the command or program name that launched each process. By default, it shows just the program name, but you can press ‘c’ to toggle between command names and full command lines with arguments.
Advanced Top Command Features
Interactive Commands and Hotkeys
The top command becomes incredibly powerful when you master its interactive features. Press ‘k’ to kill processes, ‘r’ to renice (change priority), and ‘u’ to filter by user. These hotkeys transform top from a passive monitor into an active system management tool.
Sorting and Filtering Options
You can sort processes by different criteria using various keys. Press ‘P’ to sort by CPU usage, ‘M’ for memory usage, ‘T’ for running time, and ‘N’ for process ID. Press ‘R’ to reverse the sort order, giving you maximum flexibility in data presentation.
Customizing Column Display
The ‘f’ key opens field management, allowing you to add, remove, or reorder columns. This customization capability means you can tailor top to show exactly the information relevant to your monitoring needs.
Practical Examples and Use Cases
Monitoring System Performance
When your system feels sluggish, top immediately reveals the culprits. Look for processes with high CPU or memory percentages, check the load average for system stress, and examine the idle percentage to understand available capacity.
Identifying Resource-Heavy Processes
During performance troubleshooting, sort by CPU usage to find processor-intensive applications, then by memory usage to identify potential memory leaks. The combination of these metrics usually points directly to problematic processes.
Troubleshooting Performance Issues
High wait times (wa) often indicate I/O bottlenecks, while low idle percentages suggest CPU constraints. Memory pressure appears as high swap usage or low free memory. These patterns guide your optimization efforts.
Best Practices for Using Top Command
Always examine multiple metrics together rather than focusing on single values. A process using 50% CPU might be normal for a video encoder but concerning for a text editor. Context matters enormously in performance analysis.
Consider using top in batch mode (top -b -n 1) for scripting and automated monitoring. This approach lets you capture performance snapshots for historical analysis or integrate system monitoring into larger automation frameworks.
Common Mistakes to Avoid
Don’t panic when you see high CPU percentages—check if they’re sustained or temporary spikes. Avoid killing processes without understanding their purpose, as system processes are often critical for stability.
Remember that virtual memory (VIRT) doesn’t directly indicate problems, while resident memory (RES) does. Focus on the metrics that actually impact system performance rather than getting distracted by large but irrelevant numbers.
Frequently Asked Questions
Q: Why does my process show more than 100% CPU usage in the top command?
A: CPU percentages in top can exceed 100% on multi-core systems because each core contributes to the total. A process showing 200% CPU usage on a quad-core system is utilizing two cores fully, which is perfectly normal for multi-threaded applications.
Q: What’s the difference between VIRT, RES, and SHR memory columns?
A: VIRT shows total virtual memory space (including swap and mapped files), RES displays actual physical RAM usage, and SHR represents memory that could be shared with other processes. For performance analysis, focus primarily on RES as it indicates real memory consumption.
Q: How can I kill a process directly from the top command interface?
A: Press ‘k’ while top is running, then enter the Process ID (PID) of the process you want to terminate. You can then specify the signal to send (default is SIGTERM for graceful termination, or use SIGKILL for forceful termination).
Q: What does a high load average mean, and when should I be concerned?
A: Load average represents system demand over 1, 5, and 15-minute intervals. Values equal to your CPU core count indicate full utilization, while higher values suggest the system is overloaded. Consistently high load averages (above core count) indicate performance bottlenecks requiring investigation.
Q: How do I customize which columns are displayed in the top command?
A: Press ‘f’ to enter field management mode, where you can select which columns to display and their order. Use arrow keys to navigate, space bar to toggle column visibility, and ‘q’ to return to the main display with your customized layout.
